How to measure the COP on a Vaillant Arotherm Plus Heat Pump
What is COP / SCOP?
COP or SCOP are vital pieces of information to determine how well your heat pump is working.
And they can be used as a simple benchmark to compare performance between heat pump installations.
- COP is Coefficient of Performance
- SCOP is Seasonal Coefficient of Performance
- COP is a point in time snapshot of performance. Like for an hour, a day or week for example.
- SCOP on the other hand is the performance across the whole year (or heating season).
So perhaps you’d work out your SCOP on a rolling 365 days starting from your installation date?
COP or SCOP is simply the relationship between the energy put into the heat pump and the heat it has outputted.
So a simple example would be
- Electric in: 1kWh
- Heat Output: 3.5kWh
The COP calculation would be (heat output 3.5kWh / electric in 1kWh), so a COP of 3.5
Good COP / Bad COP?
If we look at this chart from Vaillant about their Arotherm Plus models we can get a feel for expected results.

As you can see, the expected SCOP is greatly influenced by the target flow temperature of your system. Flow temperature being the temperature of the water leaving your heat pump and going around your radiators or under floor heating.
The goal is to use the lowest flow temperature possible to keep your house at the temperature you require. This will lead to a higher SCOP.
Ideally you’d set your system up to use weather compensation so that the heat pump automatically adjusts the flow temperature to track changes in outside temperature.
It’s important to remember that daily COP is also dictated by the outside temperature.
So when its -3℃ we might get a COP of 2.8, but when it’s 10℃ outside we’d hope for a COP of around 5.
You can see how the weather through the heating season would influence the overall SCOP (ie, adding up all the COP from each day and averaging it out).
If you are confused by the terms flow temperature and weather compensation, it might be worth reading my “What Size Heat Pump” blog article where we go into great detail about how I sized my heat pump and the whole system.
https://energy-stats.uk/what-size-heat-pump/
Going back to the performance chart above, a 5kW model of Arotherm Plus that runs at a flow temperature of 35℃ should achieve a SCOP of 4.48.
I say “should” because 4.48 will only be possible with good design and implementation. Again, read the “What Size Heat Pump” blog post to read about the benefits of good design and correct pipe sizing.
With a SCOP of 4.48 across the whole heating season, for every unit of electricity you put in you would get 4.48 units of heat out.
I don’t advocate running a heat pump system at 55℃ flow temp, but you should still be able to achieve a SCOP of 3.06.
Or another popular way of describing this is that the heat pump is 448% (or 306%) efficient.
Writing it this way allows a direct comparison to gas boiler efficiency. Ie, a Combi boiler, if condensing, will operate around 85% efficient.
85% versus 448% looks fantastic on paper.
But you do have to remember relationship between gas and electric pricing as detailed in this price cap forecast from Cornwall Insight.

Gas is forecast to be between 3.5 and 4.1 cheaper than Electric through 2023. So we really need to get our heat pump SCOP around that range.
You can see why you’re trying to achieve the highest SCOP you can, to bridge that price ratio differential.
Obviously, if you have solar, batteries, or perhaps an off peak or heat pump specific electricity tariff it should be easier to reduce those unit costs.
The longer term hope being that as more renewables come onstream the price of electricity will continue to drop over the years.
Finding your COP/SCOP isn’t as easy as it should be
As mentioned above, COP/SCOP is quite a simple calculation; heat output / electricity in. But many heat pump manufacturers don’t make this information easy to obtain, if at all.
You might have to dig around in your controls or on their app if there is one.
With the Vaillant Arotherm Plus we are lucky that there’s a couple of ways any end user can find this information.
I’m able to talk specifically about the Arotherm Plus as that is the heat pump I own.
If you want read more about my specific install, the details are all here.
https://energy-stats.uk/my-5kw-vaillant-arotherm-heat-pump/
Getting COP/SCOP from the Heat Pump Controller
The easiest way to get COP/SCOP information from the Vaillant Arotherm Plus is from the heat pump controller, model VWZ AI.
Here is the user guide from the Vaillant website.
This is the white box that will probably be close to your water cylinder and diverter valve.

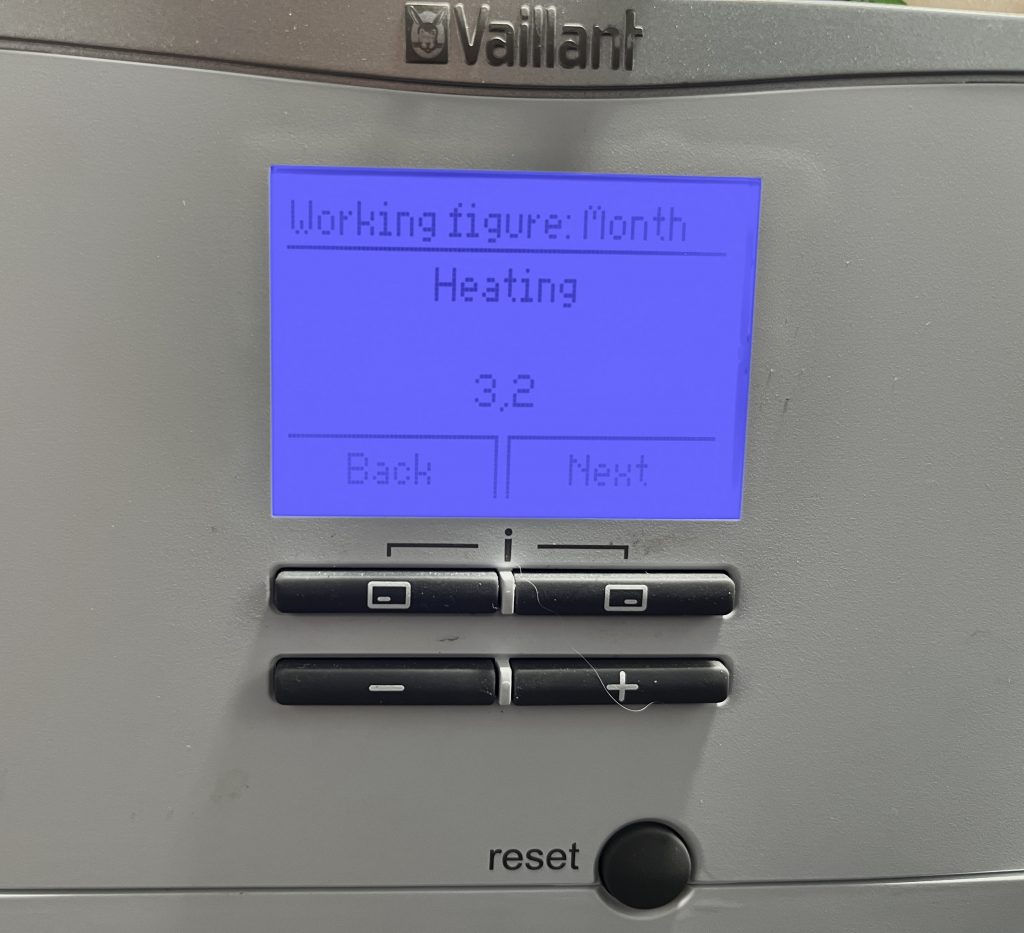
On the controller we are looking for something called “Working Figure”.
For reasons known only to Vaillant this is the term they use instead of COP/SCOP.
If we look in the instruction manual we are interested in section 4.4.4 – Yield Indicator.
In Vaillants words
“You can use this function to display the environmental energy yield as a cumulative value for a period of a day, a month and the total for the heating, domestic hot water generation and cooling modes.
You can displays the working figure for a period of a month and the total for the heating and domestic hot water generation modes. The working figure is the ratio of thermal energy generated to the operating current used. Monthly values may vary considerably since, for example, in the summer only domestic hot water generation is used.
A large number of factors influence this estimate, e.g. the type of heating installation (direct heating mode = low flow temperature or indirect heating mode via buffer cylinder = high flow temperature). This figure may therefore deviate by up to 20%.
The working figures only record the power consumption of internal components, not of external components such as external heating circuit pumps, valves, etc.“
So from the initial menu (press top left button) we want to dive into “Yield Indicator” where we can find the following: (press the + to scroll through the items)
- Working Figure: Month (Heating)
- Working Figure: Month (Domestic Hot Water)
- Working Figure: Total (Heating)
- Working Figure: Total (Domestic Hot Water)
All of these totals are cumulative for the time period stated.
Month being the current month and Total being since installation.
So if you’re interested in keeping monthly figures you probably want to go check the Month figures at the end of each month.
Here’s two photos showing my “Working Figures” on 31st December 2022.

Getting COP/SCOP from the Sensocomfort controller
Before we show how to get the info, it’s worth looking at Vaillants interpretation and wording of the details we’ll be looking at.
Strangely, no sign of the previously used term “Working Figure” from the controller.

You can find the full version of this on a Vaillant doc from their website.
So we need to know where to get “energy yield” and “power consumption” mentioned in the Vaillant document above.
I have the Sensocomfort room controller and you can get the figures from the following screens.
- From the front menu showing “Control”, “Information” and “Settings”, choose “Information”.
- From there, choose “energy data”, which shows you “environmental yield”.
- This is the “energy yield” mentioned in the Vaillant calculation.
Perhaps energy yield versus environmental yield has been lost in translation somewhere?
Note to Vaillant here: It really doesn’t help having lots of different terms for the same thing!!
Here is a Environmental Yield screen grab from 31st December 2022, so I’m going to be looking at “Current Month” figures.

Like me, if you take this snapshot on the last day of the month, you can see the total for that month (current month). Alternatively, just do it when you’re into the next month and look at “last month”.
For Power Consumption, again from the Energy Data menu, choose the “Power Consumption” option.
In here, the data can be seen as
- Heating Only
- Hot Water Only
- Cooling
- Installation (ie, all the above added together)
As the Yield figures earlier aren’t broken down into the separate elements, I’m not sure how useful the broken down power consumption figures are?
So for us to make a calculation we need to head into the “Installation” option to see the total power used.
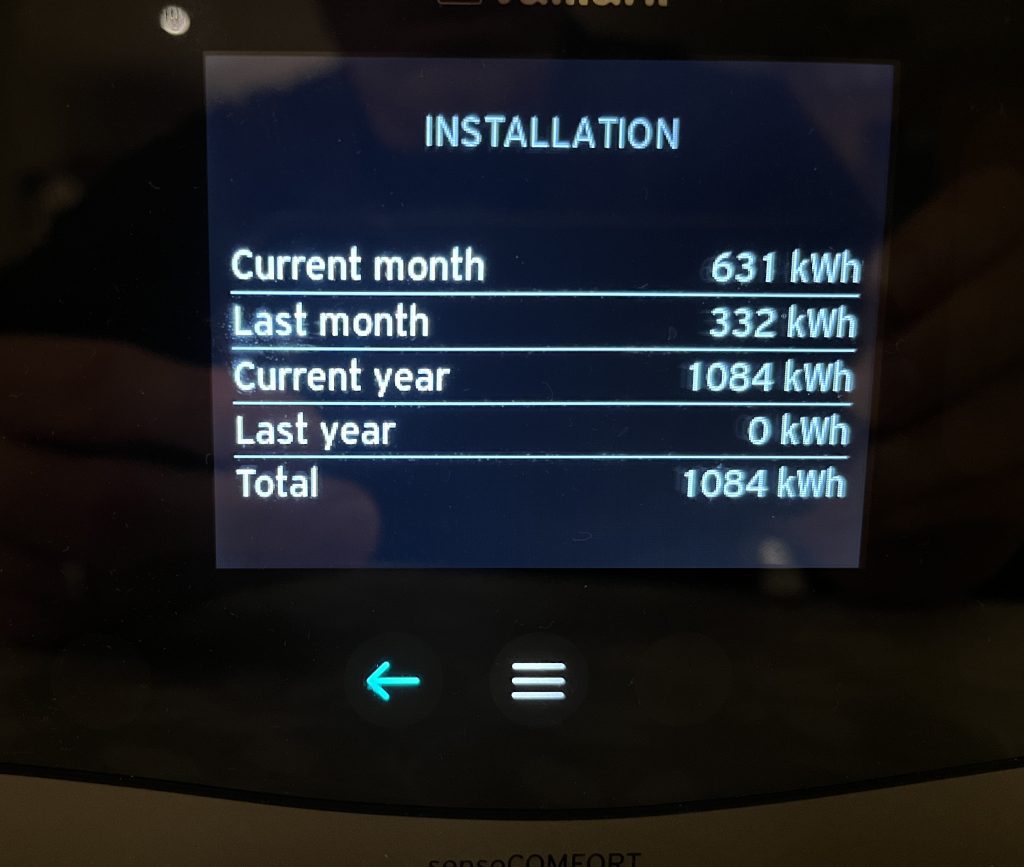
So for “Current Month” we’ve got the following figures:
- Environmental Yield: 1427kWh
- Power Consumption: 631kWh
Remember the Vaillant calc was (Yield + Power) / Power, so
- (1427 + 631) = 2058 / 631 = 3.26 COP
COP from the Open Energy Monitor and Heat Meter setup
The beauty of using a heat meter and the open energy monitor package is that the data is just so easily accessible. It logs every 10 seconds behind the scenes and you can dig into it as much as you want.
Here is the overall graph for the whole of December 2022.

As you can see at the bottom of the graph, it summarises the following
- Electric Consumption
- Heat Output
- Flow Temperature
- Return Temperature
- Outside Temperature
- Room Temperature
In December 2022 we used
- Electric in: 635kWh
- Heat Output: 2132kWh
So heat output / electric input = COP of 3.35 (as confirmed by the app itself above)
If you want to view real world historical monitoring data directly from my heat pump via the following public link
https://emoncms.org/energystatsuk/
My installation is listed alongside a whole host of the other heat pumps being monitored via the Open Energy Monitoring platform.
You can find them listed at the heatpumpmonitor website.
This is an open source endeavour looking to include a variety of make/models of heat pumps in all different build types of homes.
This monitoring was mentioned in a recent BBC News website article.
https://www.bbc.co.uk/news/business-64261457
How accurate are the Vaillant COP methods compared to the Heat Meter?
The bottom line is that the COP from openenergymonitor / heat meter setup is pretty close to the built-in Vaillant COP figures (using both the Working Figures from the controller or using the raw data from Sensocomfort controller).
So on this evidence, the built-in information on the Vaillant Arotherm Plus is likely good enough for most regular folk.
Here is a summary of the data I gathered for December 2022.
- Heat Meter COP: 3.35
- Sensocomfort COP: 3.26
- Controller Working Figure: COP 3.2 heat / 2.4 hot water – so hot water is 30% of our requirement, so an overall Working Figure of 3.0?
Whilst the COP are all around the same ballpark, we notice that the raw data from the Sensocomfort doesn’t exactly match up when compared to the calibrated heat and electrical meters.
Electric Input (1% out?)
- SDM120 Electricity Meter: 635kWh
- Vaillant: 631kWh
Heat Output (6% out?)
- Heat Meter: 2195kWh
- Vaillant: (1427+ 613) = 2058kWh
But this all appears to be close enough for most people not to care?
Note: these findings are derived from Vaillant Arotherm data. Other manufacturers will have their own way of obtaining this data and interpreting it. Please seek out your manufacturers installer guide / documentation for other makes/models.
Hope you found all this useful.
April 2023 Update
Here’s a summary of how April shaped up and how the data looked from the various sources available.
Sensocomfort Controller
- Environmental Yield: 704kWh
- Power Consumption: 192kWh
Remember the Vaillant calc was (Yield + Power) / Power, so
(704kWh + 192kWh) / 192kWh = 4.6 COP
Working Figures from Heatpump Controller
- Heating: 4.9
- Hot Water: 3.2
Hot water is about a third of our electrical usage, so that 3.2 probably drags the overall COP down to around 4.4?
Openenergymonitor Heat Meter Setup
- Electricity Used: 201 kWh
- Heat Output: 832 kWh
Heat Output / Electricity Used = 4.14

You can view each day in full detail via my page on the openergymonitor platform: https://emoncms.org/energystatsuk
New myVaillant App
In late March 2023 Vaillant replaced their sensoApp with a fresh new my Vaillant App.
This brought the ability to display Environmental Yield, Power Consumption and COP figures for any chosen date range; days, weeks, months etc.
To enable this feature you need the SensoNet controller that allows your heat pump system to talk over Wi-Fi or Ethernet to the internet.
https://midsummerwholesale.co.uk/buy/vaillant-heat-pumps/vaillant-sensonet
Here are the figures for April from this new app
- Environmental Yield: 715kWh
- Power Consumption: 194kWh
Remember the Vaillant calc was (Yield + Power) / Power, so
(715kWh + 194kWh) / 194kWh = 4.7 COP

April 2023 COP Summary
- Sensocomfort: 4.6
- Working Figure: Approx 4.4 (4.9 Heat / 3.2 Hot Water)
- New myVaillant app: 4.7 (5.1 Heat / 3.2 Hot Water)
- Heat Meter Setup: 4.14
The electrical input data seems very close, Heat Meter 201 kWh versus 194 kWh of the Vaillant app, 3.5% difference.
But the heat out seems to be where the difference is; Heat Meter 832 kWh versus 909 kWh from the Vaillant data, 8% difference.
The COP in the table above confirms much of what I’ve seen on a day to day basis when comparing the heat meter and the new myVaillnt App. The app certainly seems to overestimate COP.
When looking at the whole of April data the COP from Vaillant data is estimated higher than the accurate heat meter setup.
It is curious that the gap is slightly larger in April (4.14 heat meter versus 4.6 Vaillant) than it was in December (3.2 versus 3.4).
It will be interesting to check in again and see how these compare in future. And also whether other people are seeing similar results. I would be keen to hear from others with heat meters to compare.
Maybe post on Twitter and tag us in: https://twitter.com/energystatsuk
Conclusion
Bottom line appears to be the same advice as in December. The built in Vaillant data is probably good enough for most folks to get an idea how their system is performing.
And If you’re going to use just one method to check your COP, I’d suggest that “Working Figure” from the heat pump controller is the most accurate compared to the heat meter.
The Vaillant tools (Sensocomfort and new myVaillant app) certainly seem to be slightly overestimating COP on this evidence.
But as said above, probably not enough for most folk to really care?
Hope this helps.
If you find this information useful and are thinking of joining Octopus Energy, please consider using my referral code or ‘buy me a coffee’ to help support running costs of the website.
Using this referral code will gift you £50 of free credit after signup: https://share.octopus.energy/linen-pearl-869
If you’re considering owning part of a wind farm through Ripple Energy, get £25 of free credit (if investing more than £1000) using my Ripple referral link.
We can also be found on Twitter, please follow us @energystatsuk for daily Agile tariff pricing graphs and summaries.
Also, be sure to check out our Dashboard, Download Historical Data and OctoChargeCalc features to help you decide whether these tariffs are the right fit for you.
Note: The past performance of energy pricing is not necessarily a guide to the future.